Product Info
TimePrism
Steps to Process Improvement using Time Prism
Shoot Video of Tasks
Various formats supported.
Analyze Work
Classify and index tasks with simple click operation.
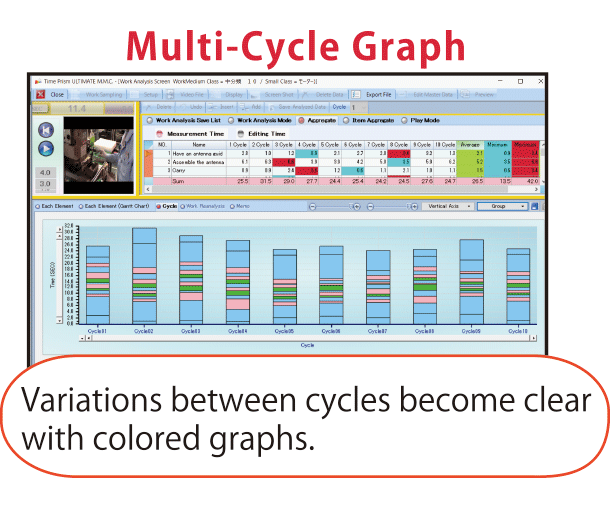
Visualize
Automatically generate color-coded, easy-to-read graphs and charts.
Find Problems/Conduct KAIZEN
Make improvements by effectively linking time, videos and graphs
Standardize Tasks/Produce Manual
Create standardized tasks, conduct training, and transfer expertise to junior personnel.
Traditional Approach:
Measure work times with a stopwatch, input data into a PC, and then create graphs and charts for analysis.
Drawbacks:
- Skilled personnel required to collect data.
- Limitations associated with analysis based solely on times.
- Data entry is time consuming.
- Creating graphs and charts is also time consuming.
- Using only graphs and charts without video severely limits how effectively improvements can be made.
Solution: Use Time Prism
Video tasks and analyze them on PC
Video tasks and upload images to PC
- Videos can be easily viewed on a PC, allowing authorized personnel to obtain data quickly, effortlessly, and accurately.
- Effectiveness of work-improvement process increased by using data and videos in conjunction with each other.
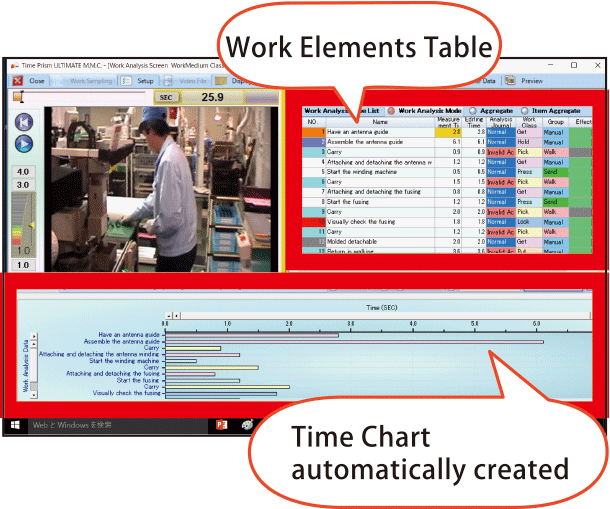
The video is split into work elements with a simple click of the mouse during playback. Frame-by-frame playback and rewinding is controlled with the mouse wheel so that measurements are more accurate.
The duration of each work element is recorded in a work element table. With a simple click of the mouse, data can be color coded to indicate classification. User-defined classifications can be saved for future use. Notes can also be added.
- Support of a variety of video formats.
Various video formats are supported, including AVI(Motion JPEG), MPEG1, MPEG2, MPEG4, H264, WMV, and MOV. The recording media is simply inserted into the PC and no format conversion is necessary, so the work analysis can begin promptly
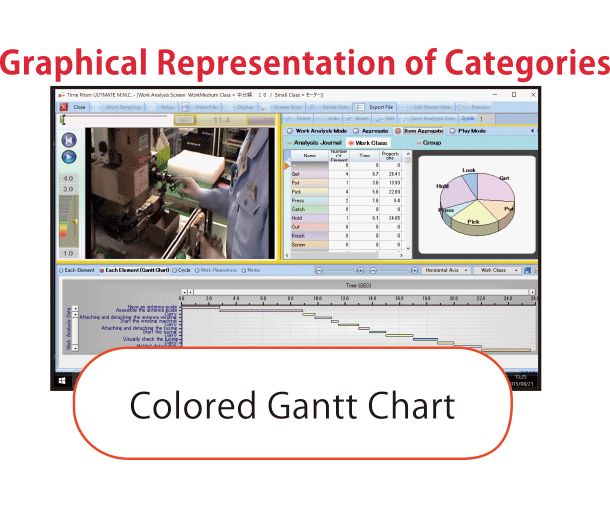
Automatic Generation of Graphs and Charts
- Videos and data easily stored on PC for later use.
- Required data, videos, charts and graphs can be quickly and easily accessed.
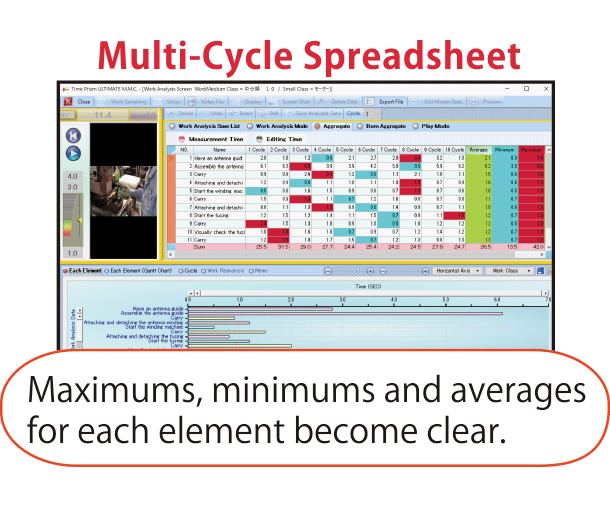
Visualization of data is possible using the various graphs and charts that can be created.
These charts and graphs can be output in various formats, including CSV and Excel, and then used to create other documents.
Stills can be copied from the video to the clipboard and saved as a JPEG file.
Comparative Verification
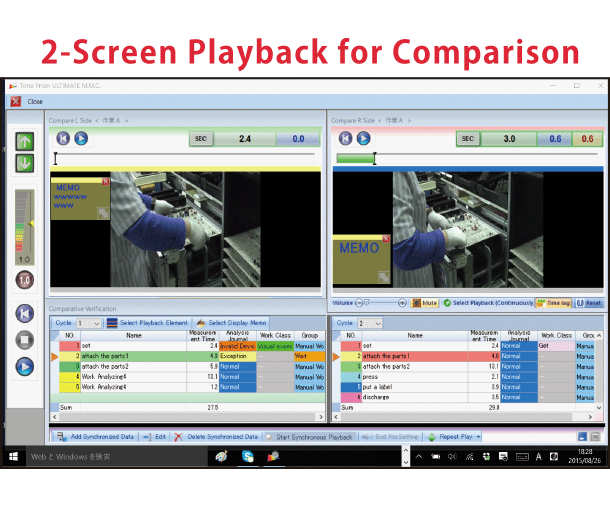
Tasks being analyzed can be played back side-by-side so that differences in work rates and motions can be easily identified.
-
Compare experienced and inexperienced workers, cycles, motions, etc.
Slow, frame-by-frame, and synchronized playback enables clear detection of motion differences and the identification of problems. -
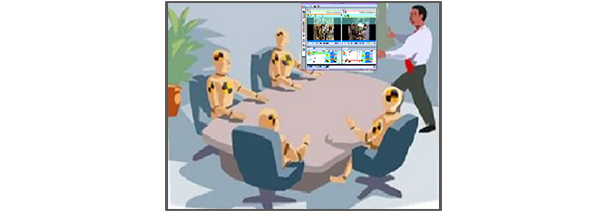
Effective for use in meetings and discussions
Ideas on how to improve the tasks being performed can be shared while videos are being watched. -
After removing waste from the process, a comparative playback of tasks before and after improvement can be made.
Excellent tool for in-house presentations.
Standard-Manual Creation
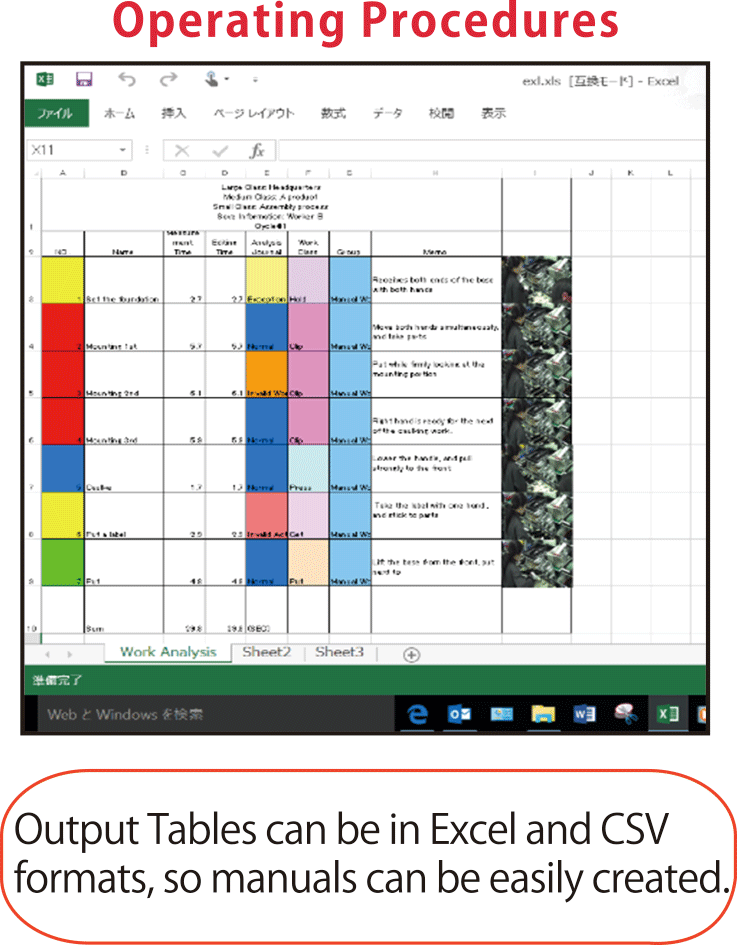
- Output Tables can be in Excel and CSV formats, so manuals can be easily created.
-
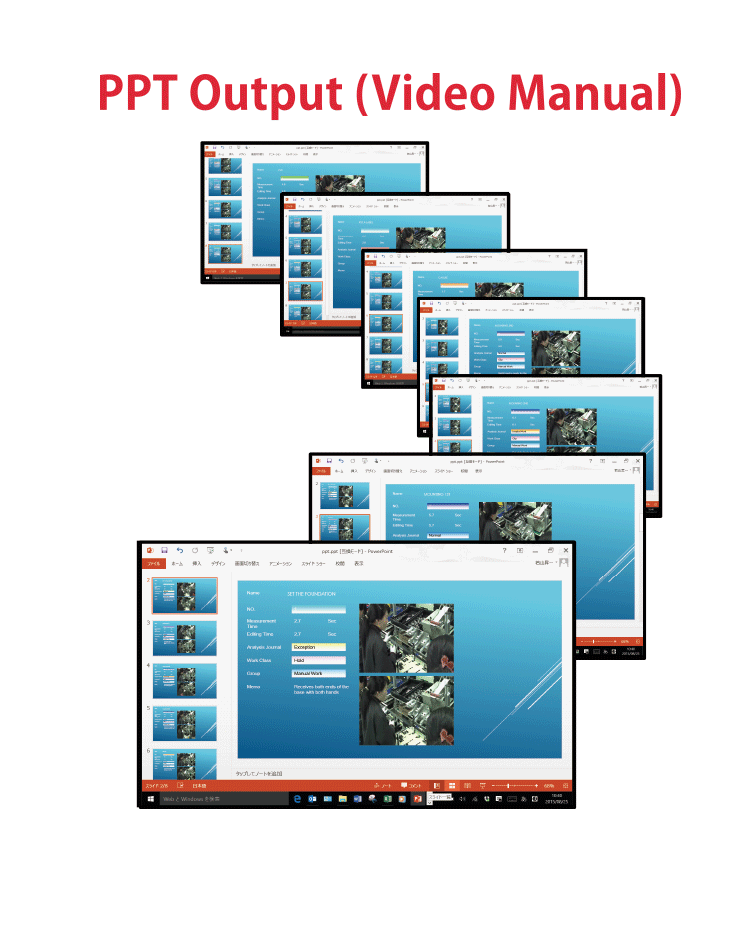
Work analysis and improvement reports can be created as PowerPoint slides.
The results of the work analysis can be used to create slides for each work element. Each slide shows the work element’s name and its time duration as well as still images and videos. Video playback as part of slide shows is also possible.
(A video file in WMV format is created for each work element. These files can be played back individually.)
Operation LevelingWork Improvement
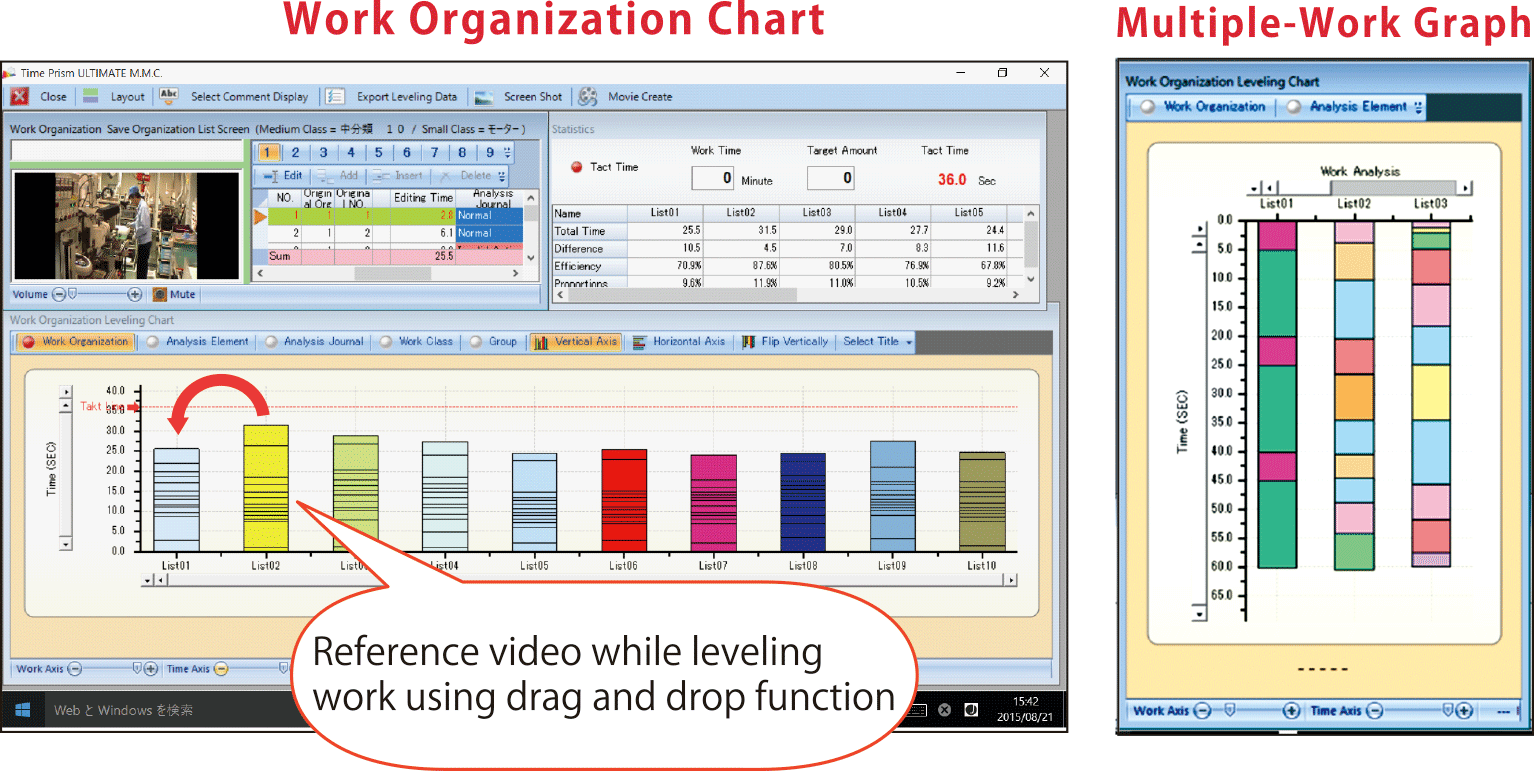
- The work elements of up to 50 processes can be easily dragged and dropped. Dragging and dropping a work element will be simultaneously reflected in work element tables and charts. By running video playback in a new sequence after work elements have been moved, the results of operation leveling can be quickly analyzed, and graphs can be created and output in Excel format.
- It is possible to display analytical data on people and machines side-by-side and thus create man-machine charts (MMC). Graphs are color coded by category and can be displayed vertically, horizontally, or inverted. User-defined orientation of graphs is also possible.
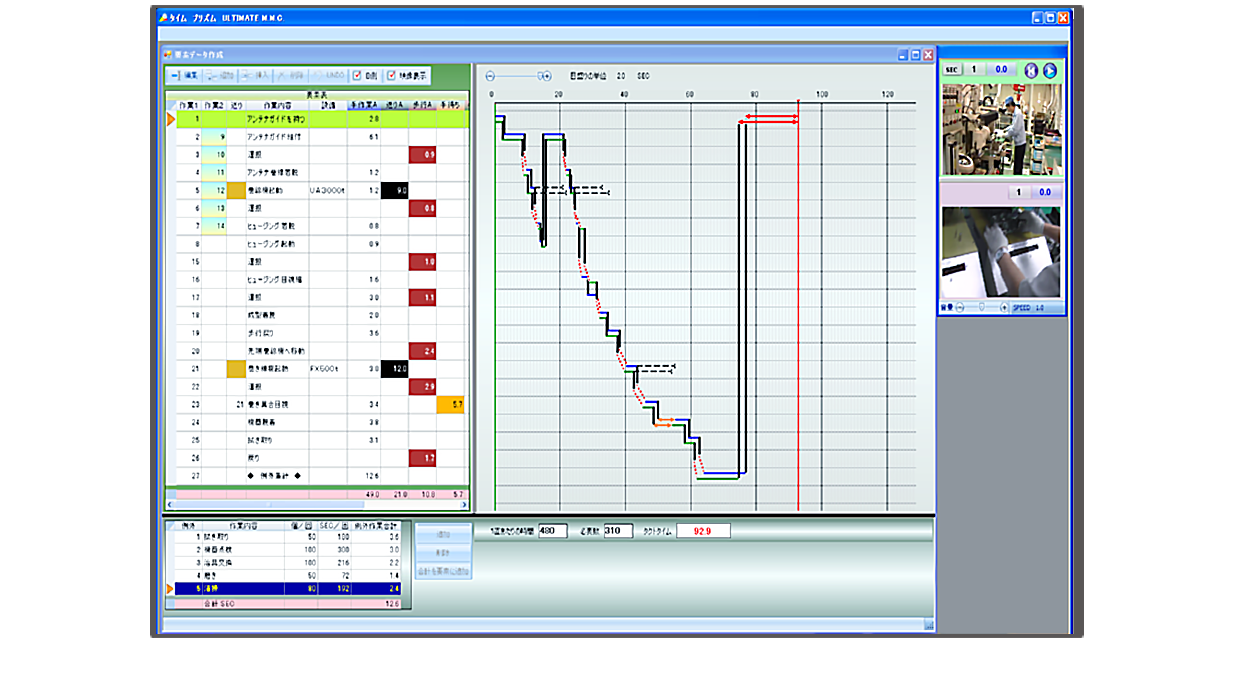
Creating Standardized Work Combination Tables (MMC)
-
Standardized work combination tables can easily be created from the work analysis data. Charts can be displayed on the screen and manipulated by dragging and dropping while at the same time the related video is being played back on the same screen. Simulations can be carried out under a variety of conditions by changing the values in tables.
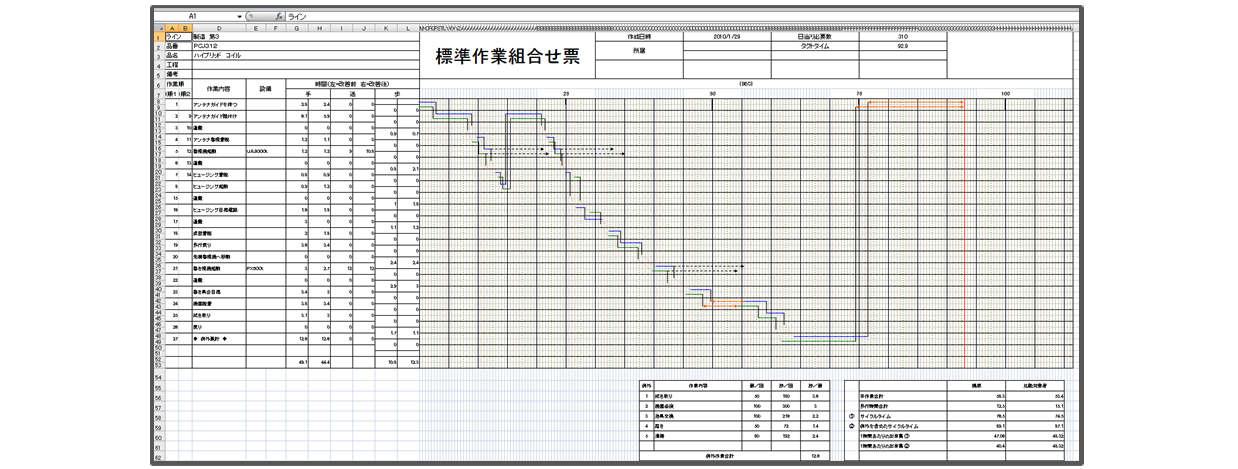
The created data can then be output as an Excel file. -
Standardized work combination tables can also be created from data imported in CSV or Excel files, which opens up a wide range of uses.
Special cases such as reworking can also be represented in the tables. Data can be output as an Excel file.
Supervision
OSAKA INSTITUTE OF TECHNOLOGY
Associate Professor
Department of Environmental Engineering
Faculty of Engineering
Kentaro MINAGAWA Dr.Eng
When carrying out Kaizen, the most important point is to always first identify the waste. If the waste cannot be identified, then Kaizen simply will not happen.
The next point is to carry out Kaizen quickly. Carrying out Kaizen quickly means that spending time analysing a process using IE techniques is not going to be the best way of doing things.
In other words, the actual carrying out of Kaizen itself needs to be subject to Kaizen and to do this it is necessary to use suitable tools. Time Prism is such a tool.
It has been developed so that tasks can be easily visualised with the use of multiple videos. Time Prism is without a doubt your best partner for carrying out Kaizen at your production site.